The draft is only a piece of roster building as free agency and trades are just as important. But with the salary cap and teams always needing to make tough decisions, it makes sense that teams that consistently draft better will be better teams. But by how much? And are there some teams that are just better at drafting?
All of this analysis uses Relative AV (the share of Approximate Value a team attained in each draft) as the core measure. The raw number is not relevant, just how a team is performing vs. the league. Teams average 3.15 total Relative AV per draft. To put this in context:
An "average" draft can take many forms. Using the above players value ranges, here are two different drafts that both get to an average draft in total value but in very different ways:
The table below shows how either a top or bottom percentile draft, or consecutive drafts, impacts a team's win percentage over the following 3-year period.
A single good, 75th percentile, draft will raise a team's winning percentage by over a game a year (almost 8%). But when a team has a great draft (90th percentile)
and can string multiple good drafts together, win percentage is impacted by 2-3 games a year over a 3-year period.
Conversely, bad drafts have a similar but negative impact on a team's win percentage.
Single draft | 2 or more drafts | |
---|---|---|
90th percentile draft (Relative AV of 5+) | 13.0% | 20.3% |
75th percentile draft (Relative AV of 4) | 7.9% | 9.8% |
25th percentile draft (Relative AV of 2) | -10.6% | -11.5% |
10th percentile draft (Relative AV of 1 or below) | -11.3% | -18.8% |
These are averages and a team's winning is impacted by a lot more than just a good draft or who they draft, particularly QB. If you look at the history of teams like Buffalo, Cincinnati, Kansas City, and Tampa Bay, you can see where they added Allen, Burrow, Mahomes, and Brady. But a QB along doesn't sustain success as the Chargers and Texans show.
Below is where each team was entering the 2022 season. On the x-axis is their 3 year draft value (teams to the right drafted better, to the left drafted worse) and
on the y-axis is their prior season (2021) win percentage. Teams are identified by color on if their record improved in 2022 (green), stayed the same within a game or two
(grey), or decreased (red).
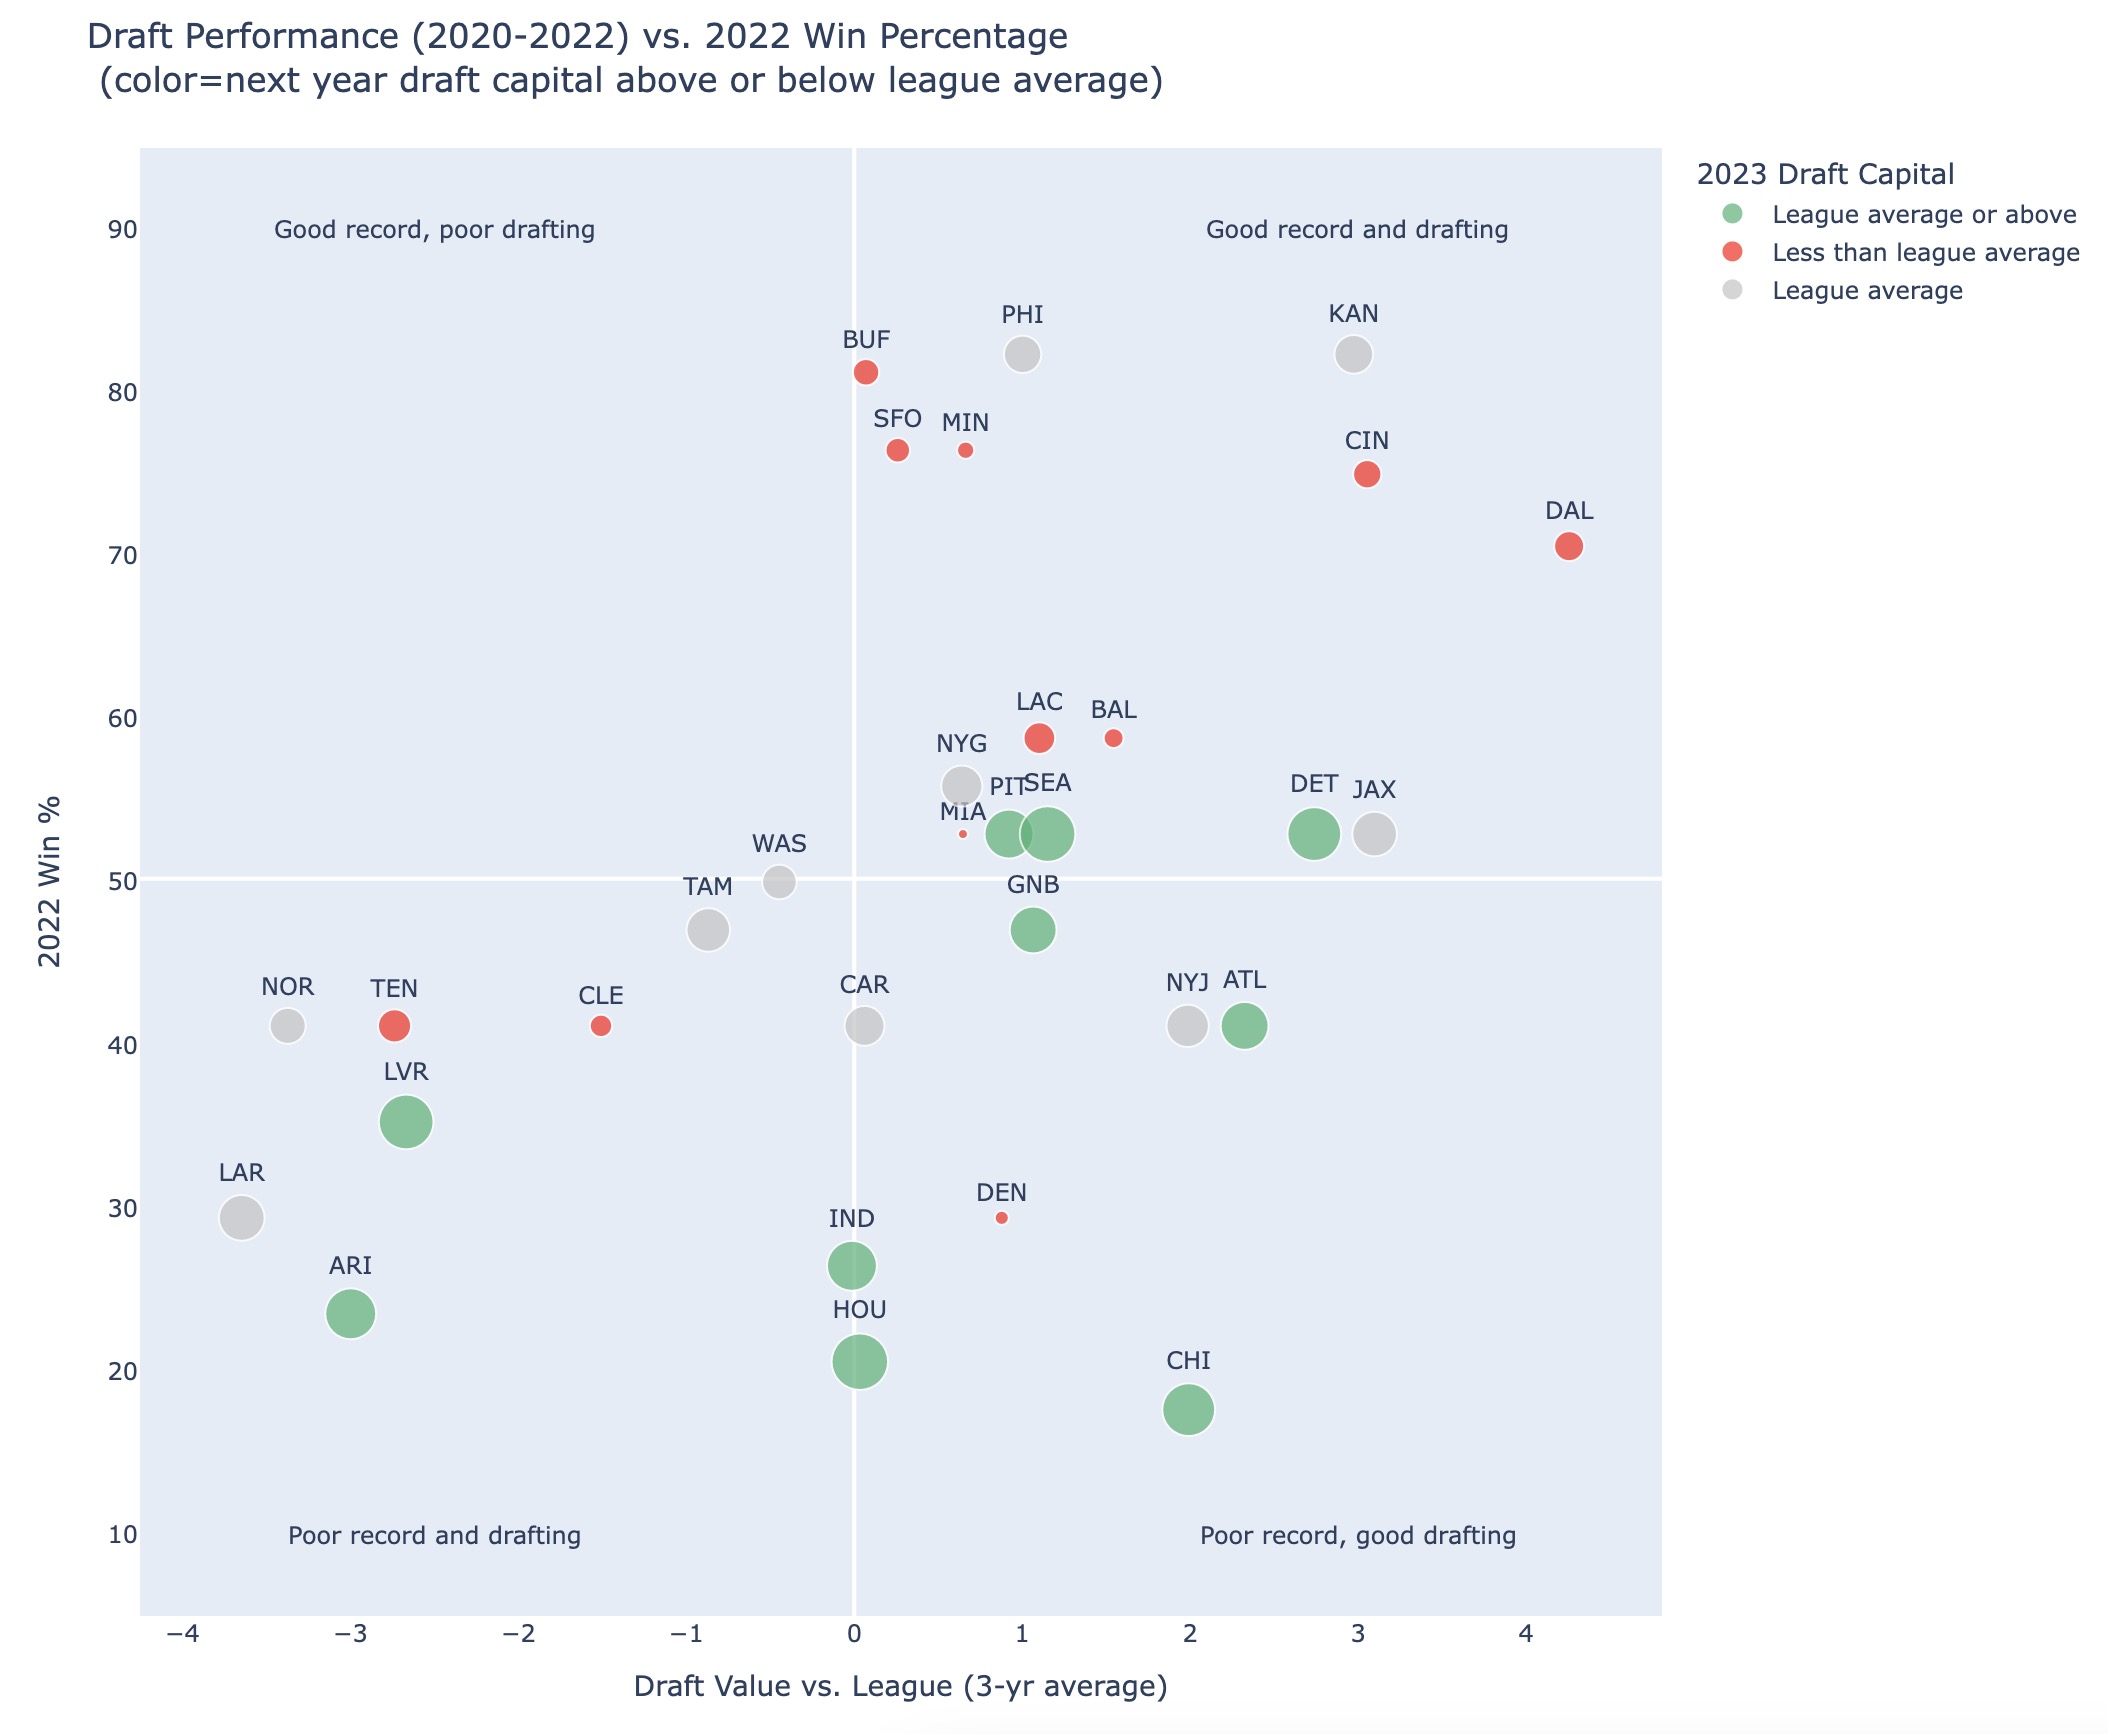
Again, a lot goes into each team's story (injuries, adding or losing a QB, etc.) but it is interesting that the teams that got worse (the red teams) are generally teams that hadn't drafted well over a several year period but were still winning. And the teams that improved (green) are almost exclusively ones that drafted better than league average. The exceptions are few:
There are a handful of teams that stand out where their recent draft performance is better than their records or the opposite, where they may be winning but haven't gotten value in recent drafts: