Ok nerd, what's all this mean...?
Definitions
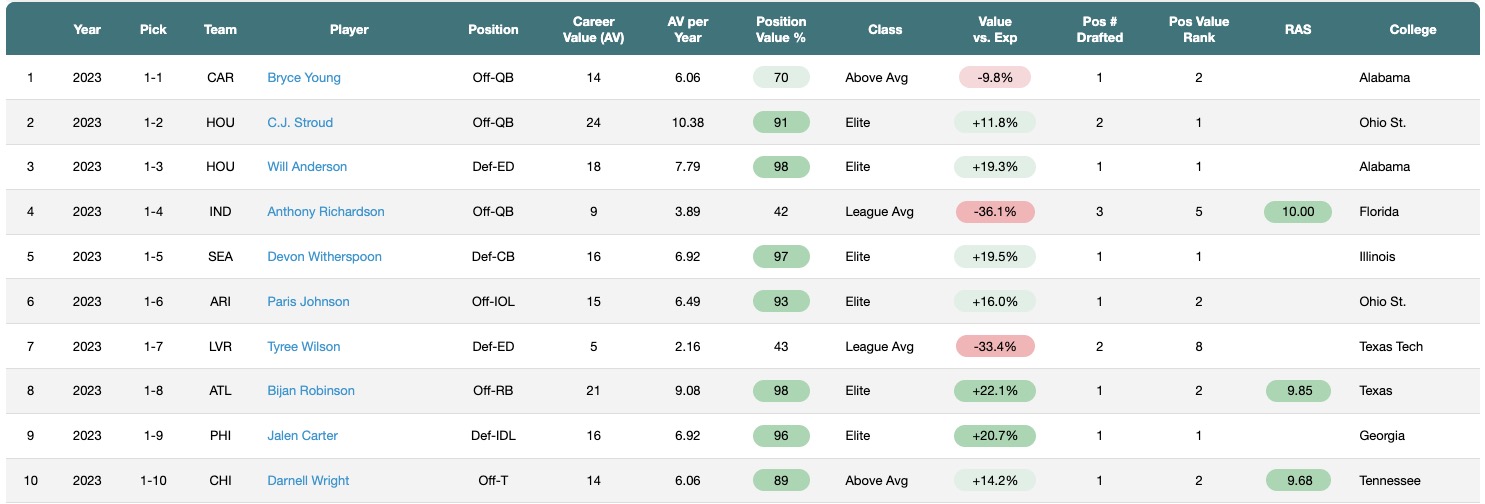
You will see the above table on the Draft page and the data there is a basis for so many of the other pages. So what does it all mean and how should you think about it?
Career Value (AV):
Approximate Value (AV) was created by PFR's founder Doug Drinen and is a great measure of player value that can be used across any position. At it's core, AV is based on how effective offensive players are
at generating points or defensive players are at preventing scoring. Many may be familiar with Expected Points Added (EPA) which is great but EPA is more useful for individual play decision-making, valuing
specific positons only (QB, RB, WR, TE), and measuring large macro trends (seasons, play types, etc.). AV is highly correlated with EPA as both are fundamentally based on points, but AV is created for all
positions, allowing valuation of players across positions.
The actual AV number a player has will not mean anything by itself, but to put some context on the actual AV number, here are some examples and player classifications:
- 20+: The elite-of-the-elite seasons, usually only a handful hit this level in any individual season and none come close averaging this level for their career. In 2024, the league leaders were Lamar Jackson (21), Josh Allen (20), and Jayden Daniels (20) wiht the Eagles Saquon Barkley and Zack Baun both coming close (18).
- 10+: The elite players and top seasons. In 2024, this group included players like Penei Sewell (18), Myles Garrett (17), and rookies Bucky Irving (12) and Ladd McConkey (11). Only 20 players have averaged this across at least several seasons since 2000 (as of the end of the 2024 season) including Mahomes (12.1), LaDanian Tomlinson (12.1), Aaron Donald (11.8), and TJ Watt (10.3).
- 6-9: Above average at the low-end and near-elite players at the top-end, including CeeDee Lamb (9.3), Patrick Surtain (8.5), and Landon Dickerson (6.4).
- 4-5: Average starters like Dan Moore (5.8) and Abraham Lucas (4.2) or very good players that have missed playing time like Trevon Diggs (5.1) and Aidan Hutchinson (5.7).
- 3 or below: Depth or part-time players and specialists like Boston Scott (2) and Zach Pascal (2)
Issues or considerations with AV:
- Player value is heavily impacted by playing time: You will see very good players with lower than expected valuations because they missed playing time - Aidan Hutchinson was mentioned above as he missed a quarter of his career playing time with his 2024 injury. Jameson Williams is another example as he missed almost the entirety of his rookie season. While one of your favorite players may look low, it makes sense as players don't provide value when they aren't on the field. And this works out over time.
- Overvaluation of QBs: AV is not alone in over-valuing QBs, teams do it in the draft every year, but because AV is fundamentally based on scoring impact, QBs will get overvalued. A couple of other positions also have some bias due to underlying playing time assumptions, but it is less severe than QBs (more on this below as I adjust for both of these).
- Extra games, extra value: Because playing time heavily impacts value, players that get extra games in the playoffs, as well as the 2021-on seasons with the extra regular season game, get extra value (more on this later as I do adjust for this).
- Accuracy over a single season: Like any metric, more data is better and AV is the same. There are players that will be over or under-valued after their rookie season, but again, this will even out over time. Just remember that for some of the 1 or 2 year player valuations.
More detail can be found on PFR's website here: https://www.sports-reference.com/blog/approximate-value/
AV per Year:
Since AV accumulates each season, players that have been in the league longer will have higher AVs and, therefore, more total value. AV per year provides a way to compare players across draft years by measuring their average impact per year.
Position Value %:
To make the valuation number more useful, each player's value is calculated into a percentile rank based on their AV per year compared against all other players that play their position. For example, Landon Dickerson's meaningless 6.4 AV translates to a 93rd percentile, meaning he has provided more value than 93% of other interior OL. To show the benefit of calculating percentiles by position, Jalen Hurts has a career AV per year of 11.3, almost double Landon's, but Hurts' value percentile is basically the same at an elite 92%.
Class:
Groups players by their Player Value % into classifications. "Elite players" are players with a value percentile of 85% or above (90% for players in the league 3 years or less to eliminate some of the small sample size noise), "Above Average" players are next and go down to 60% percentile values, "League Average" are between 40-60%, and "Poor" are below 40% percentile players.
Value vs Expected:
An expected value has been calculated for each pick slot using historical draft data. For example, the 1st overall pick has an expected 79% player percentile based on historical draft values. The 2023 top pick, Bryce Young, has a career valuation percentile of 70% but that is 10% below expected value and 21% behind 2nd overall pick C.J. Stroud. Puka Nacua, taken at pick 177 had an expected value Where AV and AV per year give a measure of a player's actual value regardless of draft spot, Value vs. Expected measures draft efficiency or productivity and is a great view on how well teams or GMs have drafted.
Position # Drafted:
Ranks players by their position order drafted. The first CB taken will be CB1 or position #1, the second CB taken would be CB2 or position #2, and so on.
Position Value Rank:
Ranks the players by the value they generated against all others drafted at their position. Used with Position # Drafted above this shows what the draft order was vs. should have been.
Example:In the awful 2022 QB class, Brock Burdy was the 9th QB taken (Position # Drafted) but 1st in QB value (Position Value Rank).
RAS:
A player's aggregate Relative Athletic Score that gives a view on a player's athletic profile from the great site ras.football.
Improvements to the valuation model
I mentioned some of the issues or considerations with AV above and I have made several improvements to the valuation model over time to get better player value percentiles:
Reducing QB Overvaluation:
To illustrate the issue with QB overvaluation, here are some player comparisons using player value percentiles based on PFR's raw AV:
- Daniel Jones and Carson Wentz are both 85th percentile players by raw AV, the same as Will Anderson and Landon Dickerson
- Mitch Trubisky is a 72nd percentile player, as valuable as guys like Mike Gesicki and Derrick Brown
- Marcus Mariota is a 90th percentile player, hilariously the same as Jaylen Waddle and Trey Hendrickson
For the math curious, I used a log transformation to decrease the natural QB overvaluation. With this, Daniel Jones drops from 85% to 68% (the same as Jermaine Johnson and Chamarri Connor), Trubisky from 72% to 53% (same as Jerome Ford and Malcolm Rodriguez), and Mariota from 90% to 65% (same as Renardo Green and Cam Hart). But the actually good QBs remain properly valued - Mahomes at 100%, Lamar Jackson at 93%, Josh Allen 92%,and Jalen Hurts 92%.
Adjusting Positional Biases:
AV makes assumptions in its calculation on how to split value up across positions and works well, but has one issue that shows up with modern defensive alignments. Without getting too deep on the calculations, PFR assumes 3.6 players are on the field in the secondary which doesn't match with nickel effectively being the new base defense and overvalues LBs at the expense of CBs. A snap-adjustment is made that properly values CBs.
Adjusting for Seasonal Shifts:
AV has a clear upward bias from 2018 on which overvalued recent players. Part of this is the addition of the 17th regular season game in 2021 as more games equals more value, but that doesn't totally explain it. A moving average-based adjustment to the model is added which smooths these years out but also preserves differentiation of good draft classes vs. not good classes.